
YouTube Analytics for Channels in 2026: Beyond Studio Basics (Including the Ask Studio Gap)

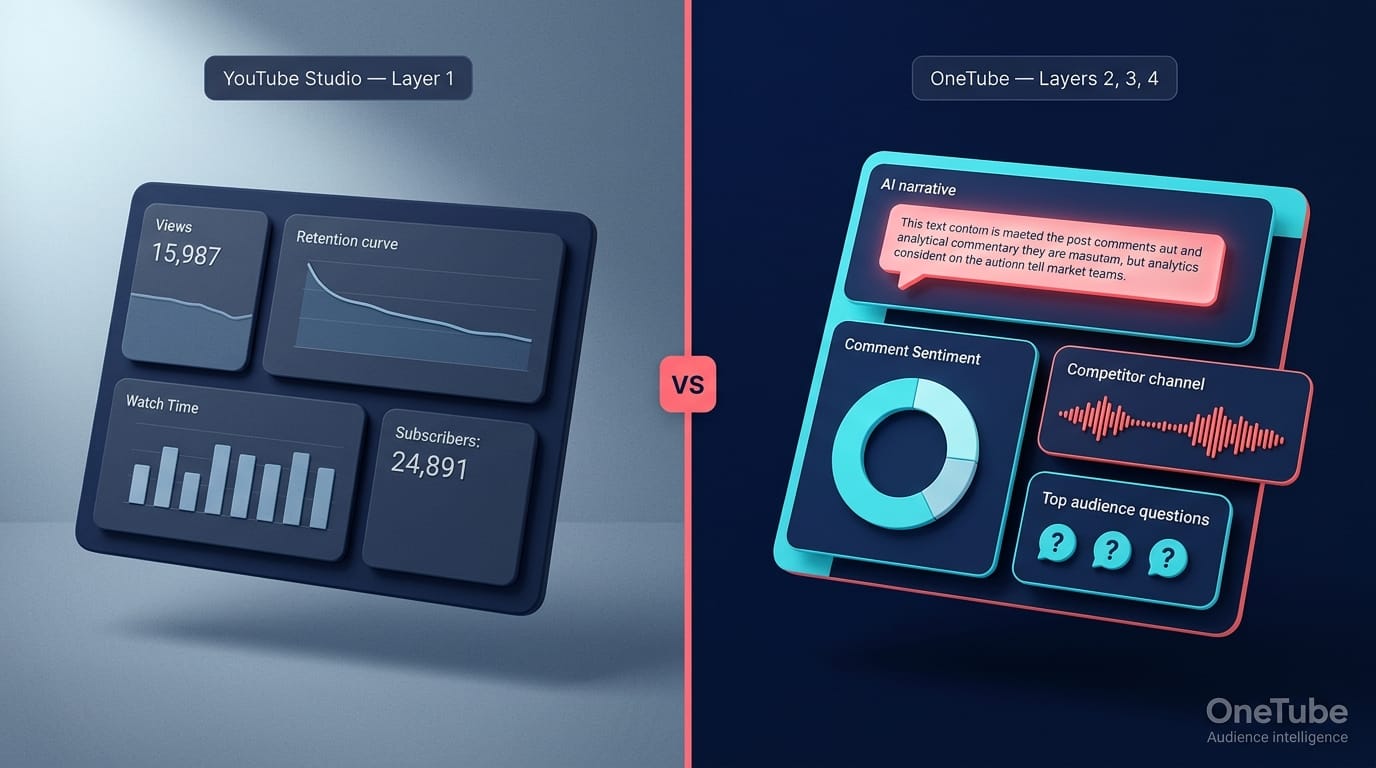
86% of global creators now use generative AI in their workflow. 44% of them specifically want AI to surface content performance insights (Adobe Creators' Toolkit Report, October 2025). That number isn't surprising. What's surprising is that until late 2026, YouTube Studio itself didn't have a real AI layer — creators were pasting screenshots into ChatGPT to get a paragraph of context Studio couldn't produce.
YouTube's response is Ask Studio, a Gemini-powered chatbot rolling out in 2026 to verified US creators (Search Engine Journal, 2026). It's a step forward — and it's still the floor, not the ceiling. Studio (with or without Ask) still shows only your own channels, still can't read what your audience is saying in the comments, and still can't tell you what your competitors are doing. Neither can vidIQ. Neither can TubeBuddy. Neither can AgencyAnalytics. None of them — and no social listening tool (Brand24, Sprout, Awario) either — ingests and classifies the full comment section of a YouTube channel you don't own at scale. That blind spot is the only layer of channel analytics nobody covers natively. This article walks through the full analytics stack creators and agencies need in 2026 — what Studio gives you, where it stops, what third-party tools add, and where the genuinely missing layer sits.
Key TakeawaysYouTube Studio covers Layer 1 (performance metrics) and partially Layer 2 (context, via Ask Studio AI for verified US creators rolling out in 2026). It does not cover Layer 3 (audience intelligence at comment depth) or Layer 4 (competitor analytics) at all.YouTube engagement rate fell from 3.73% in 2024 to 2.34% in 2025 — a 37% drop (Metricool 2025 Social Media Benchmark). If your channel dropped, it might not be a "your channel" problem. Studio won't tell you that. Industry-context analytics will.Third-party tools (vidIQ, TubeBuddy, Social Blade, AgencyAnalytics) add depth on keywords, public stats, multi-platform aggregation — but none surfaces comment-level audience signal at scale.For serious creators and agencies, the modern stack is: Studio (free, mandatory) → vertical depth tool (your choice) → comment-side audience layer (OneTube via Spy Mode). Pick one of each.
What does YouTube Studio actually show you (and where does it stop)?
The Studio floor — what's actually there
YouTube Studio's Analytics tab handles the foundational layer well. Views, watch time, average view duration, click-through rate, traffic sources, audience demographics, subscriber gain/loss, and a retention curve per video. All free, all updated near-real-time, all reliable when YouTube's servers are healthy (more on that below).
For a creator under 5,000 subscribers, Studio is genuinely enough. The metric volume isn't large enough yet to need pattern recognition tools. By 10K–50K subs, the gap starts showing.
What Studio fundamentally can't do
Five hard walls.
No competitor data. Studio shows only channels you own. You can't pull retention curves for a rival creator in your niche. You can't see their CTR. You can't see what time they upload. Google built it this way deliberately — they're not going to expose competitor analytics through your own dashboard, ever.
No comment-level sentiment or intent classification. Studio shows you the comment count next to a video. It does not classify those comments by intent (question, praise, criticism, suggestion) or emotion. If a video has 800 comments, you scroll. There is no aggregation.
No AI narrative on metric movement (until Ask Studio rolls out to your account). Studio shows you that watch time dropped 8% last month. It does not explain why. Whether the drop came from a thumbnail change, an algorithm refresh, an underperforming series, or industry-wide engagement decline — that's on you to figure out.
Limited historical depth on the dashboard. Most reports default to 28-day or 90-day windows. Longer ranges are available via Advanced Mode, but export caps and UI friction kick in fast.
Server reliability is a real risk. YouTube Studio had widespread analytics outages on March 10 and March 30, 2026, with creators reporting subscriber counts displayed as dashes and analytics pages refusing to refresh (IBTimes AU, March 2026). Studio is the floor, but the floor occasionally falls out.
2026 changes to know
Ask Studio AI, YouTube's Gemini-powered chatbot, is rolling out in 2026 to verified creators in the US starting with English (Search Engine Journal). It summarizes channel performance, interprets comments, and suggests content ideas. Real progress — but bound to your own channels, and excluded if you're outside the US or not yet on the verified-creator rollout. Most agencies and most non-US creators are still operating without it as of mid-2026.
Paid vs organic separation appeared in Studio Analytics in 2026 — separate views, engagement, and watch-time breakdowns for promoted content (SocialBee). Useful for anyone running YouTube Ads alongside organic.
The four-layer channel analytics stack
If you map what creators actually want to know about a channel, it splits into four layers. Studio covers one, partially two. The rest is open territory.
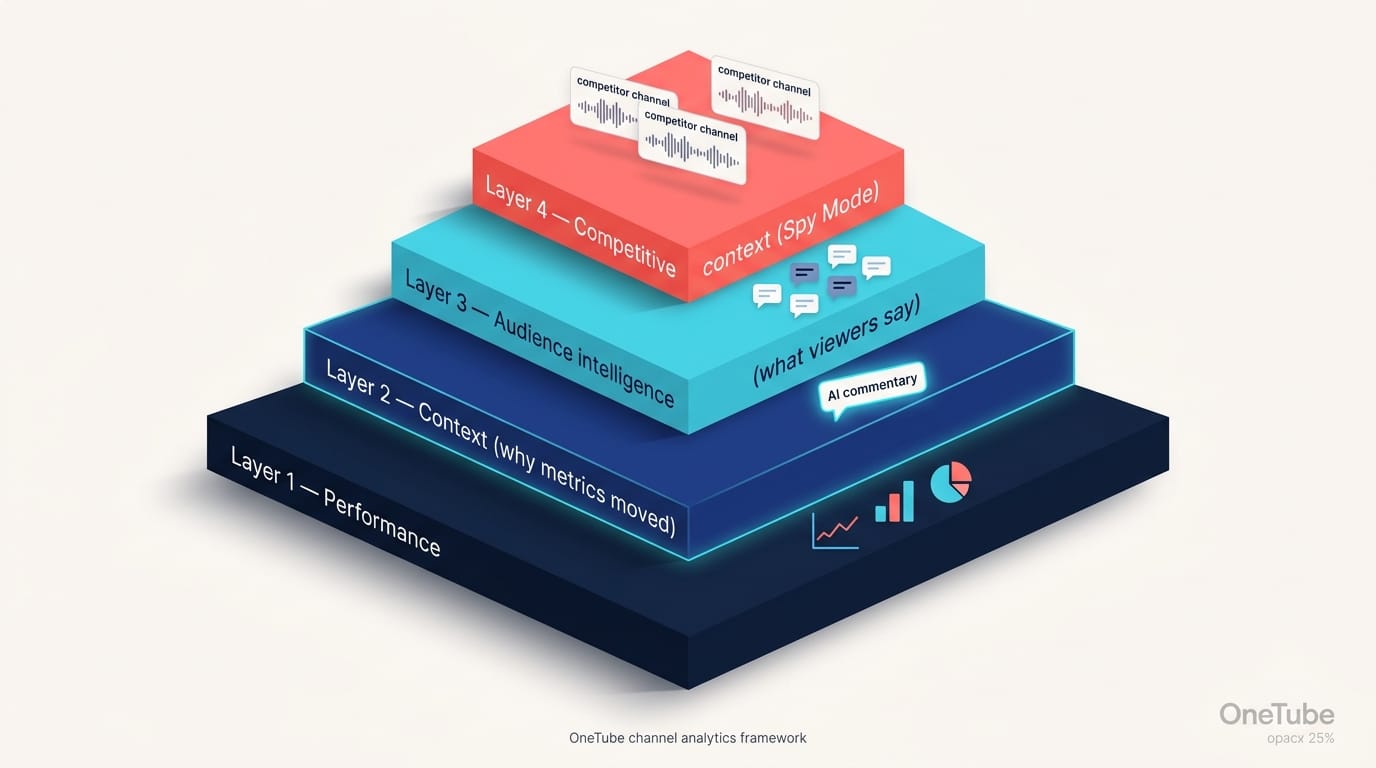
Layer 1 — Performance metrics. Views, watch time, retention, CTR, demographics, traffic sources. Studio's home turf. Free, reliable, fast. Every creator starts here, and most stop here.
Layer 2 — Context and explanation. Why metrics moved. The difference between "watch time dropped 8%" (Studio) and "watch time dropped 8% because your last three uploads were 18-minute mid-roll-heavy videos in a week where the algorithm rewarded sub-12-minute formats" (narrative layer). Studio's Ask Studio AI starts addressing this for verified US creators. For everyone else — and for any agency managing client channels — third-party AI tools cover this.
Layer 3 — Audience intelligence. What your viewers actually say, not just what they do. Comment sentiment, intent classification (question, praise, criticism, suggestion, and more), emotion mapping, audience-question extraction, content-idea mining from recurring comment patterns. This is the next-month-direction layer — what should you publish next, based on what your audience is already asking for. Studio does none of it. Most third-party tools don't either.
Layer 4 — Competitor audience voice (Spy Mode). NOT competitor metrics — those are private. YouTube Studio won't show you a rival's CTR or retention, and no tool can fake what Google doesn't expose. What we mean: the comment section on any public competitor channel — every viewer question, suggestion, criticism, surfaced verbatim. The "what to make next" signal sitting in public comment threads on channels you don't own. Native YouTube Studio is structurally blind here. Most analytics tools inherit the limitation because they pull from the OAuth-gated YouTube Analytics API.
"If your competitor has 200 comments asking variations of 'but how does this work for small businesses?' — and they're not making that video — you are."
A creator running on Studio alone has Layer 1 and (maybe) Layer 2. A creator running on Studio + a keyword/SEO tool like vidIQ adds keyword research depth but stays inside Layer 1's worldview. A creator who's bottlenecked on what to make next needs Layers 3 and 4 — that's what most modern tools miss.
Why raw metrics fail you without narrative
Paddy Galloway — YouTube growth strategist with 500K+ creator following and consulting credits including MrBeast — captured this in a 2021 thread that's aged better than most: "This graph shows something very important about audience retention on YouTube. First 24 hours (17k views): 56% retention. Most viewed 24 hours (120k views): 37% retention." (@PaddyG96, October 25, 2021).
Translation for analytics in 2026: same channel, same video, different audience composition. The 56% retention came from existing subscribers (warm, primed). The 37% retention came from algorithm-driven cold traffic (skeptical, browsing). Looking at the average — 41% or whatever — and concluding "my retention is bad" is the wrong answer. There were two different stories happening.
Studio doesn't tell you that. It shows you one average number, attaches a red-or-green arrow, and moves on.
Context also lives in industry baselines. YouTube engagement rate across all creator content fell from 3.73% in 2024 to 2.34% in 2025 — a 37% year-over-year drop (Metricool 2025 Social Media Benchmark). Meanwhile, average views per video grew 76% (389.90 → 687.21). Translation: more eyeballs per video, but they're sticking around less. If your channel's engagement dropped 37% last year, the honest first-pass diagnosis isn't "I broke my channel." It's "I'm in line with the industry, and the question is what to do about a structural shift."
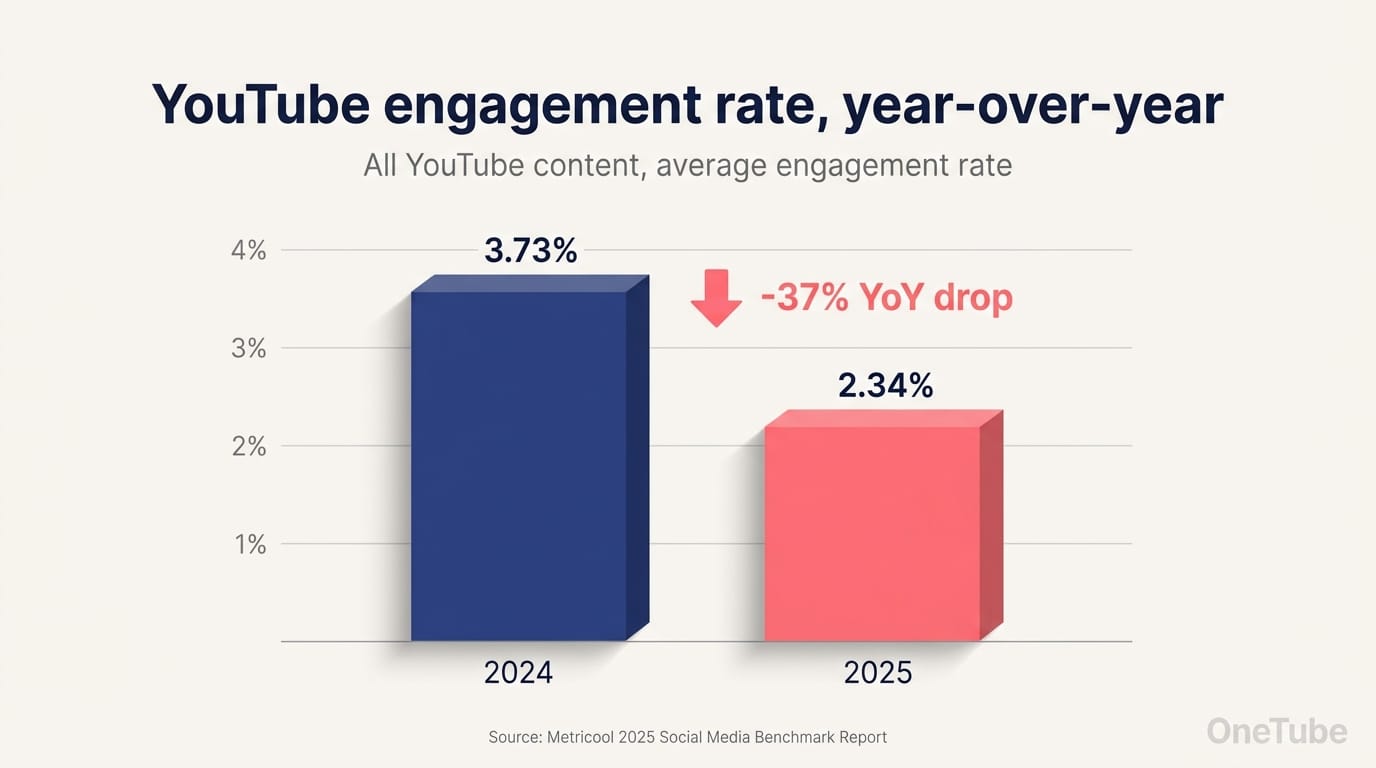
The story is bigger than your channel. Without industry context, you're optimizing against the wrong baseline.
Third-party analytics tools — what each one actually adds
Quick map of the analytics tools real creators and agencies pay for in 2026, sorted by what they actually extend.
Comparison matrix
| Tool | What it adds beyond Studio | Entry paid tier ($/mo) | Strongest at | Misses |
|---|---|---|---|---|
| vidIQ | Keyword research, video SEO scoring, AI daily content ideas, basic competitor metadata via extension | $16.58 (Boost annual) | AI ideation + trend discovery for solo creators | Comment intelligence, multi-channel scale |
| TubeBuddy | Studio overlay, bulk video edits, A/B title/thumbnail testing, 3-channel competitor tracking on Legend | $9 (Legend annual) | Bulk catalog work + thumbnail testing | Comment depth, audience-side analytics |
| Social Blade | Public stats for any channel — subs/views/projections, historical tables | $3.99 (Bronze) | Quick public-stat lookup, any channel | Behind-the-scenes data, sentiment, retention |
| AgencyAnalytics | Multi-client dashboards combining YouTube + 85+ other platforms, AI insights, white-label branding | $20/client (Core annual) | Agencies running multi-platform reporting | YouTube-specific depth, comment intelligence |
| OneTube | Comment-side intelligence (intent + emotion classification on every comment), Spy Mode (competitor channel analysis), AI Pulse Reports (narrative on metric movement) | $9 (Creator) | Audience-direction + competitor signals — the Layer 3 + 4 gap | Multi-platform aggregation (we're YouTube-only by design) |
AI audit of any YouTube channel
Drop a competitor's URL. In 5–15 minutes, get the full breakdown of what's working, what's broken, and exactly what to film next.
- 🎯Their content ideasVideos their audience keeps asking for that they never made
- ⚠️Their weak spotsExact topics and formats where viewers tune out or push back
- 💬Audience questionsStraight from their comment section — your next 10 scripts
- 📋A ready content planRanked backlog of what to film next, pulled from real demand signal
- 🔥Their superfansWho's emotionally invested in the channel and what gets them to talk
Just a URL and an email. Report lands in your inbox.
Pricing verified May 2026 against vendor pages. We compared the SEO-focused tools head-to-head separately if you're choosing between them — vidIQ vs TubeBuddy covers that decision in detail.
Which tool covers which layer
vidIQ and TubeBuddy stay mostly inside Layer 1 with some Layer 2 (AI ideation, scoring commentary). Social Blade extends Layer 1 to public/competitor channels (you can see subs and views for any channel, but no behind-the-scenes data). AgencyAnalytics aggregates Layer 1 across many clients and many platforms — that's its job, not depth. OneTube focuses on Layers 3 and 4 — comment-side audience signal on your channels and on competitors. Pulse Reports add Layer 2 narrative explanation on top.
Stack matters more than picking one. A solo creator with vidIQ + Studio covers Layers 1-2. An agency with AgencyAnalytics + Studio covers Layer 1 across many clients. Either configuration is blind to Layers 3 and 4.
The missing layer — comment-side analytics
Here's the structural part most "YouTube analytics" articles skip.
Studio counts your comments. It does not classify them. It does not tell you the recurring themes across 800 comments on a viral video. It does not surface the top recurring questions across the last quarter of uploads. It cannot tell you that 60% of your skeptical commenters cluster around one specific format choice you keep making.
Most third-party analytics tools inherit this gap. They pull from the YouTube Analytics API (own-channel only) and the YouTube Data API (which returns comment text without aggregation or classification). Adding intent + emotion classification on every comment requires a separate NLP pipeline and real AI cost per channel — most tools have correctly decided not to build it for general analytics customers.
OneTube did build it specifically. Every comment ingested across your channels — and across competitor channels you add in Spy Mode — gets classified by intent and emotion. The output rolls into per-channel Pulse Reports: verbatim top audience questions, top criticism themes, top content ideas surfaced from the comment stream. Our comment intelligence deep-dive walks through the full pipeline.
"YouTube Studio shows your metrics. OneTube shows what your competitors' audiences are asking for — verbatim, across every channel you track. The audience-voice section a dashboard can't produce."
Spy Mode is the part most analytics articles don't have an equivalent for. Add any public YouTube channel to your workspace; the same comment classification runs against it. Your Pulse Report includes a dedicated competitor-mentions block showing what rival audiences are asking for that you can build before they do. We covered content-gap analysis specifically in a separate guide.
How this differs from YouTube's new Ask Studio: Ask Studio is bound to your own channels and (for now) US-verified creators only. OneTube spans your channels and competitor channels, works regardless of your country, and delivers AI narrative as a structured report rather than a chatbot — easier to share with clients or your team.
How to actually use analytics — weekly and monthly workflow
Pure data doesn't change a channel. A workflow does. Here's the practical rhythm that works in 2026.
Daily (5 minutes). Studio mobile app — quick check on the last 24-hour video performance. Looking for outliers: a video unexpectedly spiking or dropping. Outliers are signals; everything else is noise on a daily timescale.
Weekly (30 minutes). Studio desktop dashboard — retention curves on the last 1–2 uploads, traffic source breakdown, top 5 videos by VPH (views per hour). Adjust the next upload's thumbnail or hook if a clear pattern emerges. If you use a keyword/SEO tool, this is also when keyword refresh happens.
Monthly (90 minutes). This is where you actually go beyond Studio. Generate a Pulse Report or equivalent. Read what your audience asked for in the last 30 days (verbatim). Read what your top 3 competitor channels' audiences asked for that those creators haven't covered yet (Spy Mode). Decide the next month's content slate from that input, not from your own gut.
Quarterly (3 hours). Competitive recalibration. Are the right competitors in your Spy Mode workspace, or has the niche shifted? Audit which content gaps you covered and which you didn't. Refresh the channels list. Re-baseline against industry benchmarks (Metricool publishes annually).
For agencies running this for clients, the cadence compresses — daily monitoring is automated, weekly is per-client review, monthly is the deliverable. We covered agency reporting workflows separately if that's your context.
Five analytics mistakes creators keep making
- Tracking everything = tracking nothing. Studio shows ~30 metrics. Pick 5 that drive your decisions. Anything else is noise.
- Comparing to last week, not your cohort. Your channel's 12% drop in views means nothing without industry context. Pull the Metricool annual benchmark — see if your number is normal or anomalous.
- Ignoring comment-side signal because it's "soft." A wave of "please make a beginner version" comments across 8 videos is the strongest direction signal you'll get. Don't dismiss it because it's not a percentage.
- Outsourcing analytics interpretation without ground-truth checks. If you give a VA the analytics dashboard and ask for a report, verify what they're flagging against your own weekly check. AI narrative tools (Ask Studio, Pulse Reports) reduce the VA reliance but don't eliminate the need to sanity-check.
- Treating Studio's defaults as Studio's recommendations. Studio defaults to 28-day windows because that's what fits on a screen, not because 28 days is the right comparison window for your content. Change the window when the question changes.
Frequently asked questions
How do I view analytics for my YouTube channel?
Sign in to YouTube Studio, click Analytics in the left sidebar. You'll see Overview, Content, Audience, Reach, Engagement, and Revenue tabs. Free, available to any channel, mobile + desktop. For deeper analytics — competitor data, comment intelligence, AI narrative — you'll need a third-party tool layered on top.
Can I see other YouTube channels' analytics?
Not their internal Studio analytics — Google won't expose another creator's CTR, retention, or demographics to you. You can see public stats (subs, view counts, video counts, historical projections) via Social Blade for any channel. For competitor-side analytics that go deeper — what their audience says, what content gaps exist, what they're winning at — OneTube's Spy Mode adds a public-channel competitor analysis layer; we wrote up content-gap analysis with that approach in detail.
What is the best free YouTube analytics tool?
YouTube Studio itself, for own-channel analytics — nothing free covers Studio's depth on metrics you own. For public stats on any channel, Social Blade's free tier is fine. We tested five free analyzers separately in our free YouTube channel analyzer comparison — that piece covers which gaps each free tool closes.
What is Ask Studio in YouTube?
Ask Studio is YouTube's AI chatbot — Gemini-powered — that summarizes channel performance, interprets comments on your own channels, and suggests content ideas. Rolling out in 2026 to verified US creators in English first (Search Engine Journal, 2026). It covers Layer 2 (context) for your own channels. It does not cover competitor channels or comment intelligence at the level a dedicated tool would.
What does "average view duration" actually mean for ranking?
Average view duration (AVD) = total watch time ÷ total views. It's one of YouTube's strongest ranking signals, alongside click-through rate. The catch: AVD is heavily influenced by video length. A 10-minute video with 6:00 AVD and a 3-minute video with 2:30 AVD both have 60% retention, but YouTube's algorithm reads them differently in different contexts. Use AVD in combination with average percentage viewed (APV), not alone. Per Paddy Galloway's 2021 retention point — early audience vs algorithmic cold traffic also creates large AVD swings on the same video.
How is OneTube different from YouTube Studio?
Different categories, not competition. Studio is your own-channel metrics dashboard. OneTube is YouTube comment intelligence — the audience-voice layer Studio doesn't ship and the OAuth wall keeps every other analytics tool out of. Spy Mode reads any public competitor channel's comment section; Pulse Reports classify intent and emotion across every comment surfaced. Studio shows what happened on your channels. OneTube shows what audiences (yours and your rivals') are asking for. Most serious creators run both.
What to do next
If you're under 10K subs and just learning analytics: stay on Studio. Pick 5 metrics that matter (views, watch time, AVD, CTR, retention curve). Check them weekly. Don't overcomplicate.
If you're 10K–100K subs and bottlenecked on what to publish next: the bottleneck isn't keyword optimization — it's audience direction. Studio + a keyword tool won't fix that. Layer 3 (audience comment intelligence) is the gap to close. Run a free Spy Mode audit on your biggest competitor right now — no card, no account needed, just a URL and an email. The Pulse Report lands in your inbox in ~15 minutes. If reading what their audience is asking for doesn't change how you think about next month's slate, the post wasn't useful enough. The 7-day trial (also no card) is the upgrade for ongoing weekly tracking once you've seen what the audit returns.
If you're an agency running client channels: you need Layer 1 across many clients (AgencyAnalytics at $20/client or equivalent) + Layer 3 and 4 for the strategic recommendation that justifies your retainer. Pulse Reports with white-label branding sit on Agency Starter tier ($199/mo) and above — branded PDFs with your logo and colors, no OneTube branding on the client-facing deliverable. Run the free audit on a client's biggest competitor to see what the white-label report would surface.
The creators and agencies who win 2026 on YouTube won't be the ones with the most-tracked metrics. They'll be the ones with the cleanest stack — one tool per analytics layer, no overlap, no missing layer.
Related reads
- Best free YouTube channel analyzers in 2026 (tested) — what free tools cover (and where they share the same Layer 3 gap)
- YouTube comment analyzer: read 4,000 comments without losing your week — the comment-intelligence pipeline this article references
- vidIQ vs TubeBuddy in 2026: Honest comparison + where both miss — choosing between the two SEO-focused tools
- YouTube reporting tools for agencies in 2026 — multi-client reporting workflows